Wheat Yield and Nitrogen Response: A Spatial Analysis
GIS Portfolio Project — ArcGIS Pro, Geostatistics and Spatial Statistics About this project: a guided laboratory exercise for SPAT5008 Applied GIS at Curt...
GIS Portfolio Project — ArcGIS Pro, Geostatistics and Spatial Statistics
About this project: a guided laboratory exercise for SPAT5008 Applied GIS at Curtin University, using a supplied teaching dataset with fabricated locations. It demonstrates GIS and statistical methods. It is not original agronomic research, and its findings should not be applied to a real paddock.
Does applying more nitrogen produce more wheat, and is the pattern the same everywhere in a paddock? A single paddock-wide average can hide a lot, so this exercise combines mapping, interpolation, statistical tests and local relationship analysis to look at both the overall pattern and how it varies across space.
| Nitrogen rate (kg/ha) | Points (n) | Mean yield (kg/ha) |
|---|---|---|
| 0 | 2,875 | 4,679.29 |
| 60 | 1,054 | 4,782.16 |
| 120 | 944 | 4,716.36 |
| 180 | 855 | 4,716.57 |
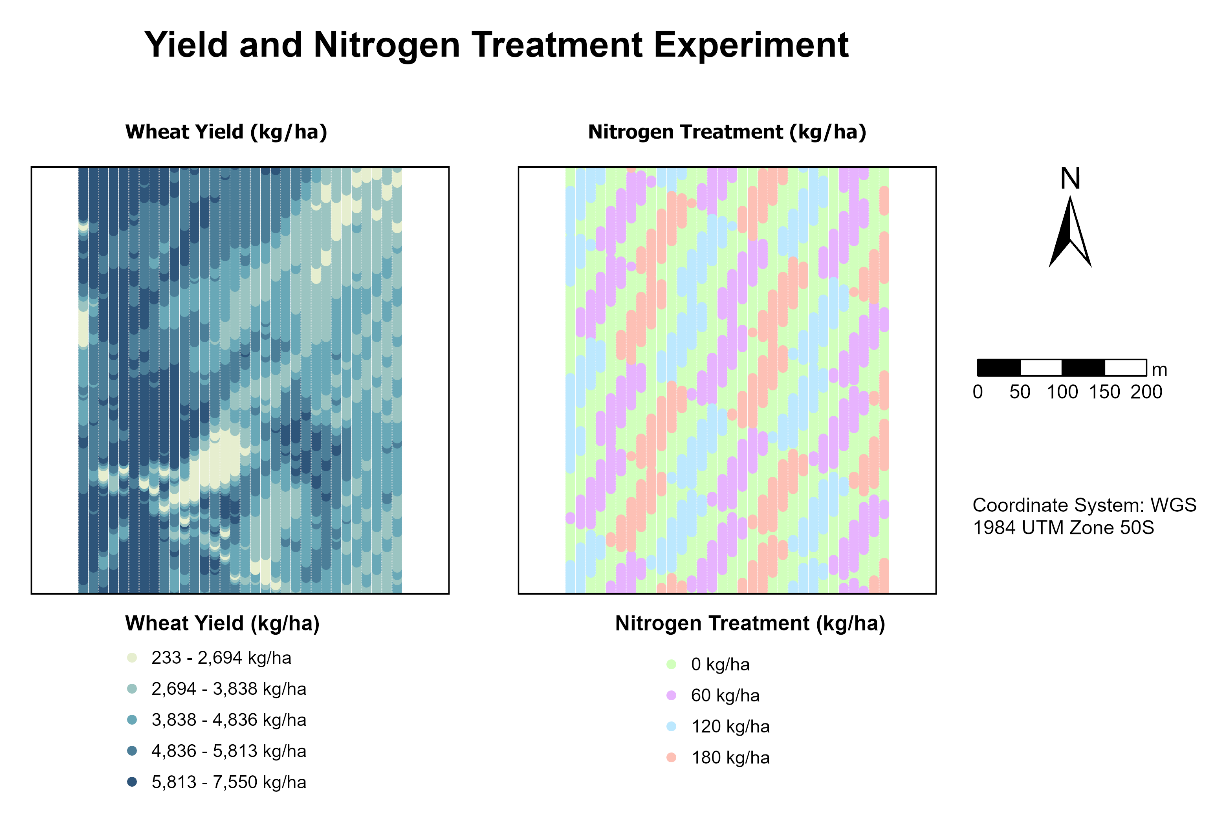
Figure 1. Wheat yield (left) and the checkerboard nitrogen treatment design (right) across the experimental paddock.
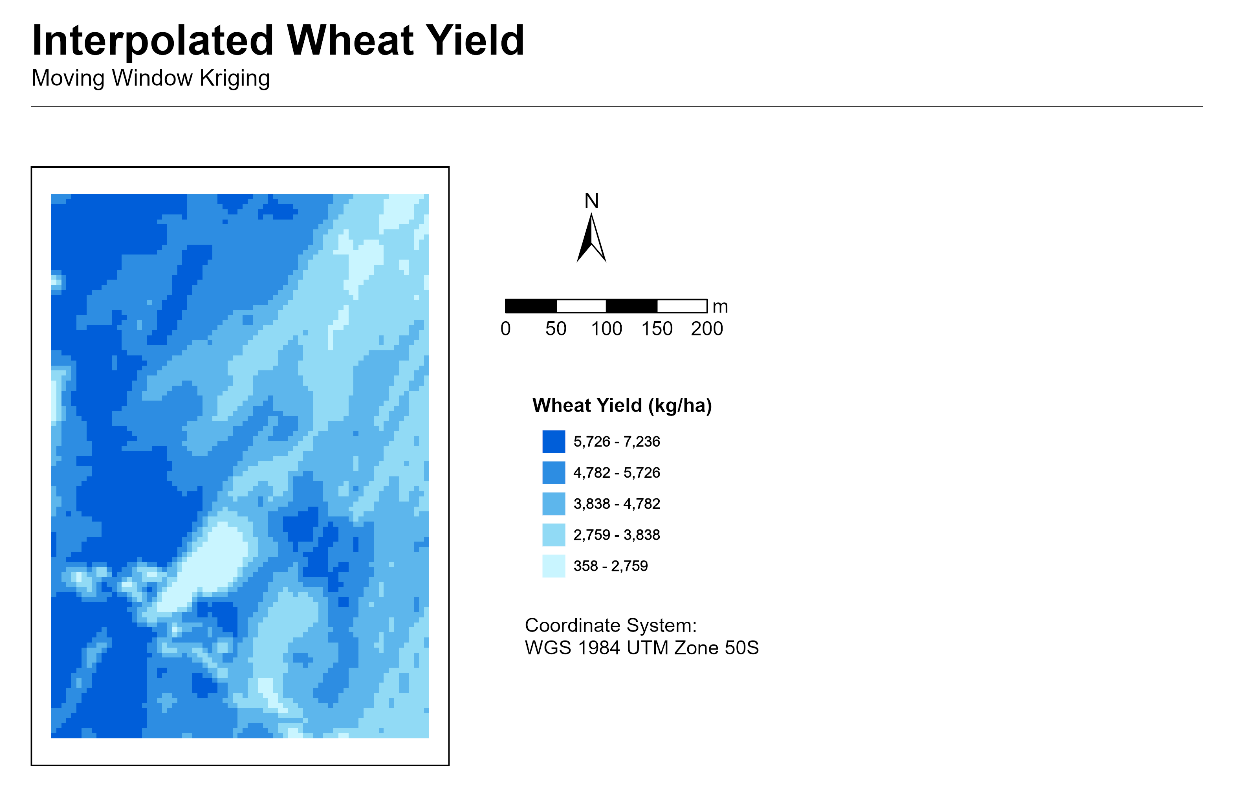
Figure 2. Predicted wheat yield using Moving Window Kriging, with a 100-point neighbourhood and 5 m output cells.
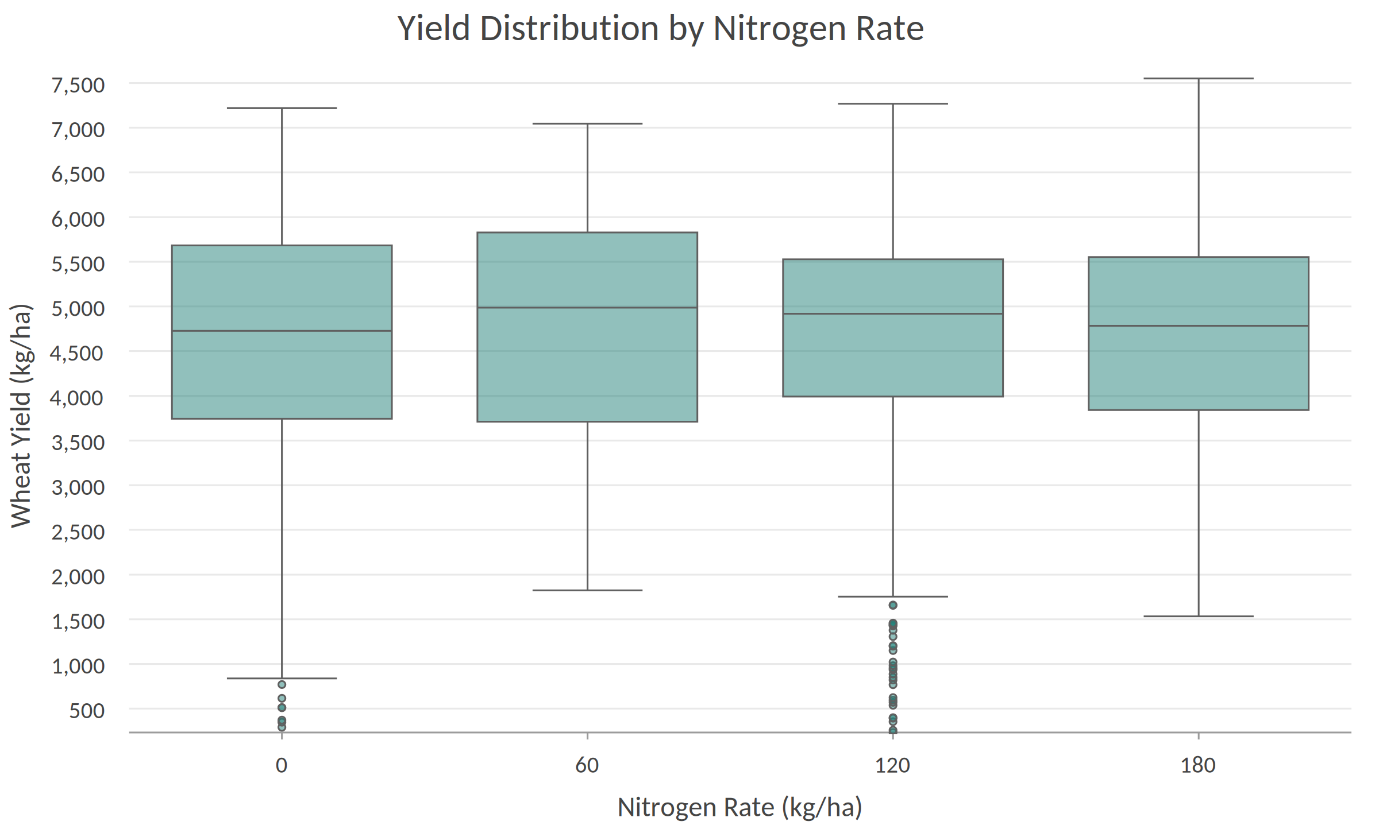
Figure 3. Wheat yield distributions across four nitrogen treatments (0, 60, 120 and 180 kg/ha; n = 2,875, 1,054, 944 and 855 points, respectively). Median yields were broadly similar, with substantial overlap between groups and no consistent increase as nitrogen rate increased.
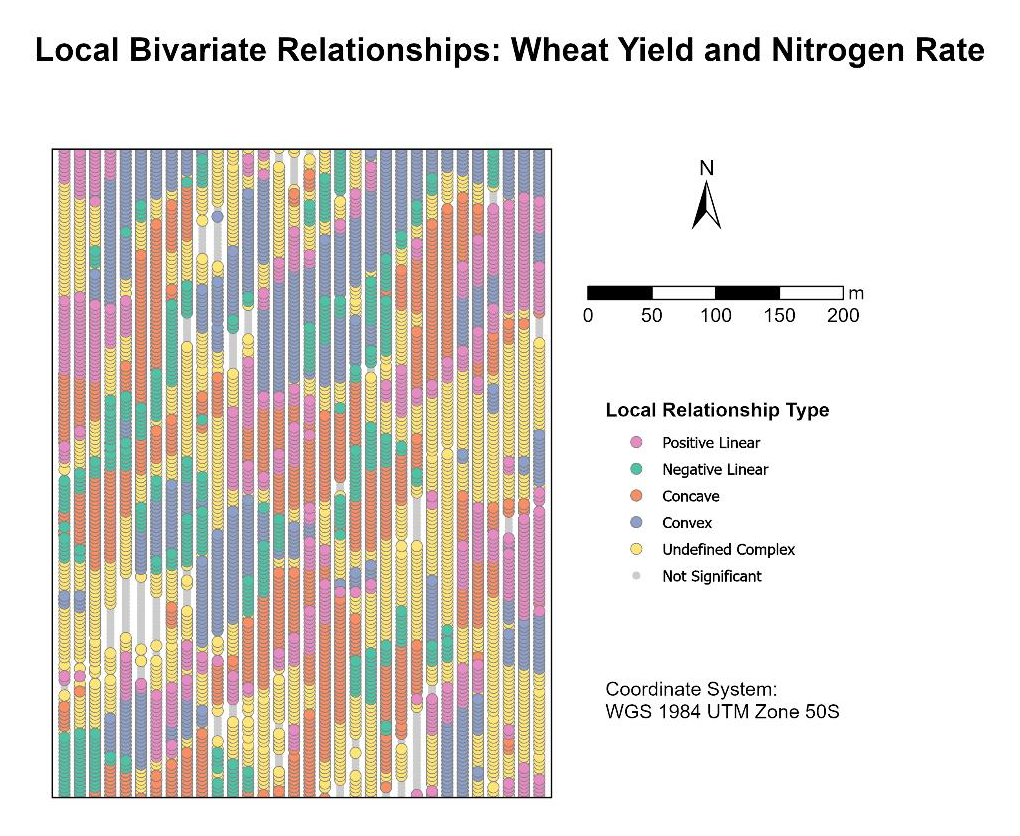
Figure 4. Local Bivariate Relationships between wheat yield and nitrogen rate, showing six local relationship types across the paddock.
All figures were produced during a guided laboratory exercise using a supplied teaching dataset with fabricated locations.
| Category | Detail |
|---|---|
| GIS | ArcGIS Pro (kriging, Summary Statistics, Local Bivariate Relationships, layouts and cartography) |
| Statistics | Pairwise Z-tests in a Jupyter Notebook |
| Skills | Spatial interpolation and geostatistics, experimental design interpretation, hypothesis testing, spatial pattern analysis, cartography, and clear reporting of limitations |
Data and attribution: supplied teaching dataset (SPAT5008 Applied GIS, Curtin University), not redistributed here. © 2026 Moshraf Hossain. All rights reserved in my original text and cartographic contributions. Supplied teaching materials and any third-party content are excluded from this notice and remain subject to their respective terms.
GIS Portfolio Project — ArcGIS Pro, Geostatistics and Spatial Statistics About this project: a guided laboratory exercise for SPAT5008 Applied GIS at Curt...
Globe Bank International — Customer Retention Analysis Python Portfolio Project | End-to-End Customer Churn Analysis
Training Analytics Dashboard Power BI Portfolio Project | Data-Driven Talent Development Insights
Introduction This SQL project involves analyzing the sales and customer data of H+ Sport, a fictitious company that sells nutritional products and active lif...
Introduction The project is to demonstrate the use of SQL to extract meaningful insights from a hospital database. This includes analysing patient demographi...
Your brain has two systems, a slow analytical side and a quick, instinctive “gut” side. For the most part, the instinctual side is lazy, conserving its energ...
“Color does not add a pleasant quality to design—it reinforces it.” — Pierre Bonnard
Tips for Designing a Color Palette In the first two sections of this book, Color Limitations and Color and Emotions, we looked at some interesting facts abou...
Color and Emotions Mention Thanksgiving to any American and they will paint a picture in their head with gold, orange, red, and brown hues. It will also like...